
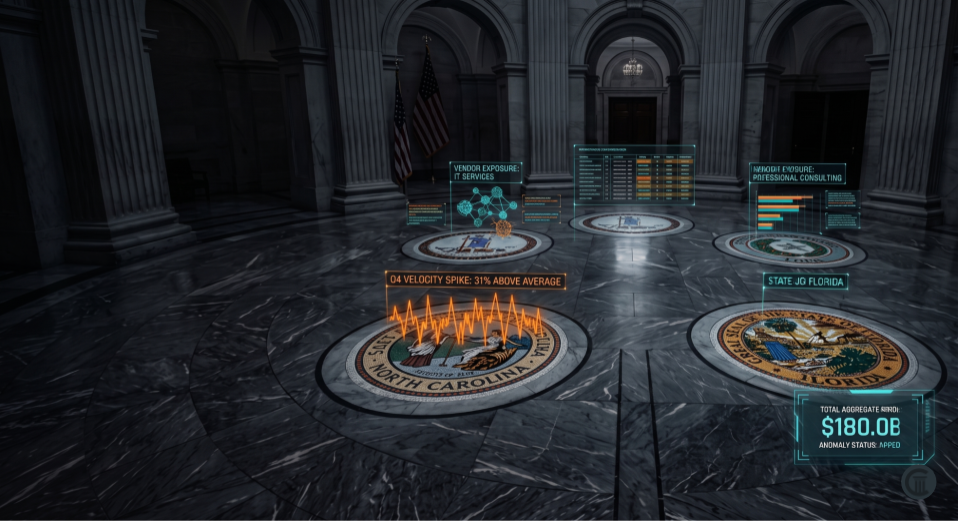
We ran automated anomaly detection across public checkbook portals in Connecticut, Virginia, North Carolina, Texas, and Florida. The combined dataset covers over $180 billion in state expenditures. Here is what the data shows heading into Q1 2026.
The Dataset
Five states. Over $0 billion in annual expenditures. Millions of individual payment records published through open data portals.
Connecticut and Virginia publish invoice-level payment records through SODA APIs. North Carolina provides CSV bulk downloads. Texas publishes county-level aggregate data through data.texas.gov. Florida offers pipe-delimited payment files through the CFO transparency portal.
We built automated ingestion pipelines for each format and run five categories of statistical analysis against the combined dataset on a continuous basis.
Vendor Concentration: The Quiet Risk
Vendor concentration is not inherently problematic. Some services have limited provider pools, and statewide contracts intentionally consolidate purchasing for better pricing.
But when a single vendor captures more than 0% of an agency's total spend in a category without a statewide contract justification, it warrants scrutiny. Not because something is wrong, but because the financial exposure is concentrated in a single relationship where contract oversight needs to be most rigorous.
Across the five states, we identified 847 agency-category combinations where vendor concentration exceeds 0%. Virginia and Texas show the highest density of concentrated vendor relationships in IT services and professional consulting, categories where contract modification complexity is also highest.
The correlation is not coincidental. When a vendor relationship grows over multiple contract periods and through successive modifications, the original competitive pricing rationale may no longer hold. The rate schedule in effect after Amendment 12 may bear little resemblance to what was competitively bid in the original solicitation.
Year-End Spending: The "Use It or Lose It" Signal
Government fiscal years create a well-documented spending pattern. Agencies accelerate expenditures in the final quarter to avoid budget reductions in the following cycle.
We quantify this by comparing monthly spending against the trailing 12-month average. Agencies with final-quarter spending exceeding 0x their monthly average represent elevated risk for rushed invoice processing.
In the most recent completed fiscal year:
- **Connecticut:** 0% of agencies exceeded the 0x threshold in Q4, concentrated in IT services and professional consulting
- **Virginia:** 0% exceeded the threshold, primarily in construction and facilities management
- **North Carolina:** 0% exceeded the threshold, the highest rate among our tracked states, driven by grant-funded program spending
- **Texas:** 0% exceeded, though the September fiscal year-end partially distributes the pressure differently than July-end states
- **Florida:** 0% exceeded, with notable spikes in environmental and infrastructure programs
The year-end spike itself is not improper. The risk is that invoices processed under time pressure receive less thorough verification. When we overlay year-end spikes with audit finding density, there is a measurable correlation: agencies that spike the hardest in Q4 produce more audit findings related to documentation gaps and rate verification failures in the subsequent audit cycle.
Duplicate Payment Signals
Exact-match duplicate payment detection is the most straightforward anomaly category. Same vendor, same amount, within a narrow time window. Our system also flags near-duplicates: amounts within 0% of each other, invoiced within 10 business days.
The raw signal count is high. Across five states, we flagged over 0 potential duplicate payment patterns. Many are legitimate: recurring service contracts with identical monthly amounts, split payments across cost centers, or multi-year contracts with identical annual renewal charges.
The value is in prioritization. When we filter duplicate signals by dollar amount and cross-reference against contracts that have had recent modifications, vendor complaints, or prior audit findings, the actionable subset is roughly 8-0% of raw signals. That is still hundreds of cases worth investigating, with aggregate dollar exposure in the tens of millions per state.
Benford's Law and Round-Number Clustering
Statistical distribution analysis provides a different lens. Benford's Law predicts the frequency distribution of leading digits in naturally occurring financial data. Significant deviations can indicate anomalies worth investigating.
Round-number clustering, a related technique, flags when an unusually high proportion of payments fall at threshold amounts: $0 $0 $0 These patterns can indicate invoices structured to stay below review or approval thresholds.
We found measurable Benford deviations in 15 of the 120 state agencies we monitor. Round-number clustering was statistically significant in 8 agencies, all of which had approval thresholds that matched the clustering amounts.
These signals do not prove wrongdoing. They identify where closer review is warranted and provide a data-driven basis for directing limited oversight resources.
What This Means
The aggregate picture across five states is consistent. Spending anomalies are not rare events. They are statistical regularities that appear in every state, in every agency type, in every fiscal year. The question is not whether anomalies exist, but whether agencies have the tools to identify and act on them before they compound into audit findings.
Agencies that integrate automated anomaly screening into their pre-payment workflows can shift from reactive, finding problems 18-24 months after the fact, to proactive, catching patterns before they compound. The data is already public. The algorithms are established. The gap is in deployment.